INJ/USDT1h
2026-06-03 · 41 candles
18WEAK
- Direction
- 1 of 3 right
- Inside 80% range
- 3 of 3
- Moved
- −7.04%
2 horizons called the wrong way.
Point your phone at any candlestick chart and get an 80% range for where price lands next — an interval built to contain four moves in five, which on the reserved test split contained81–85%.
Direction we measured at 50–51%, which is a coin flip, so we stopped selling it. Everything on this page is a number we published, including the ones that went against us.
Not submitted yet. The form below is the only way to hear about it, and it sends one message.
Fig. 02 — the product, not a description of it
Beat 01
A photo of a broker screen, a screenshot from a trading app, a chart on someone else’s monitor. If it has candles, it gets read — crypto or equities, any timeframe, no account linking and no API key.
Beat 02
The candles it digitised are drawn back over your image with a count. A forecast built on a misread chart is worse than no forecast, so the extraction is shown rather than assumed — you can see it got the bars right before you believe anything downstream of them.
Beat 03
The dial is a percentile of what this engine actually produces, stretched so the needle and the word underneath it agree. A typical forecast reads mid-dial and says so. Nothing here is tuned to look impressive.
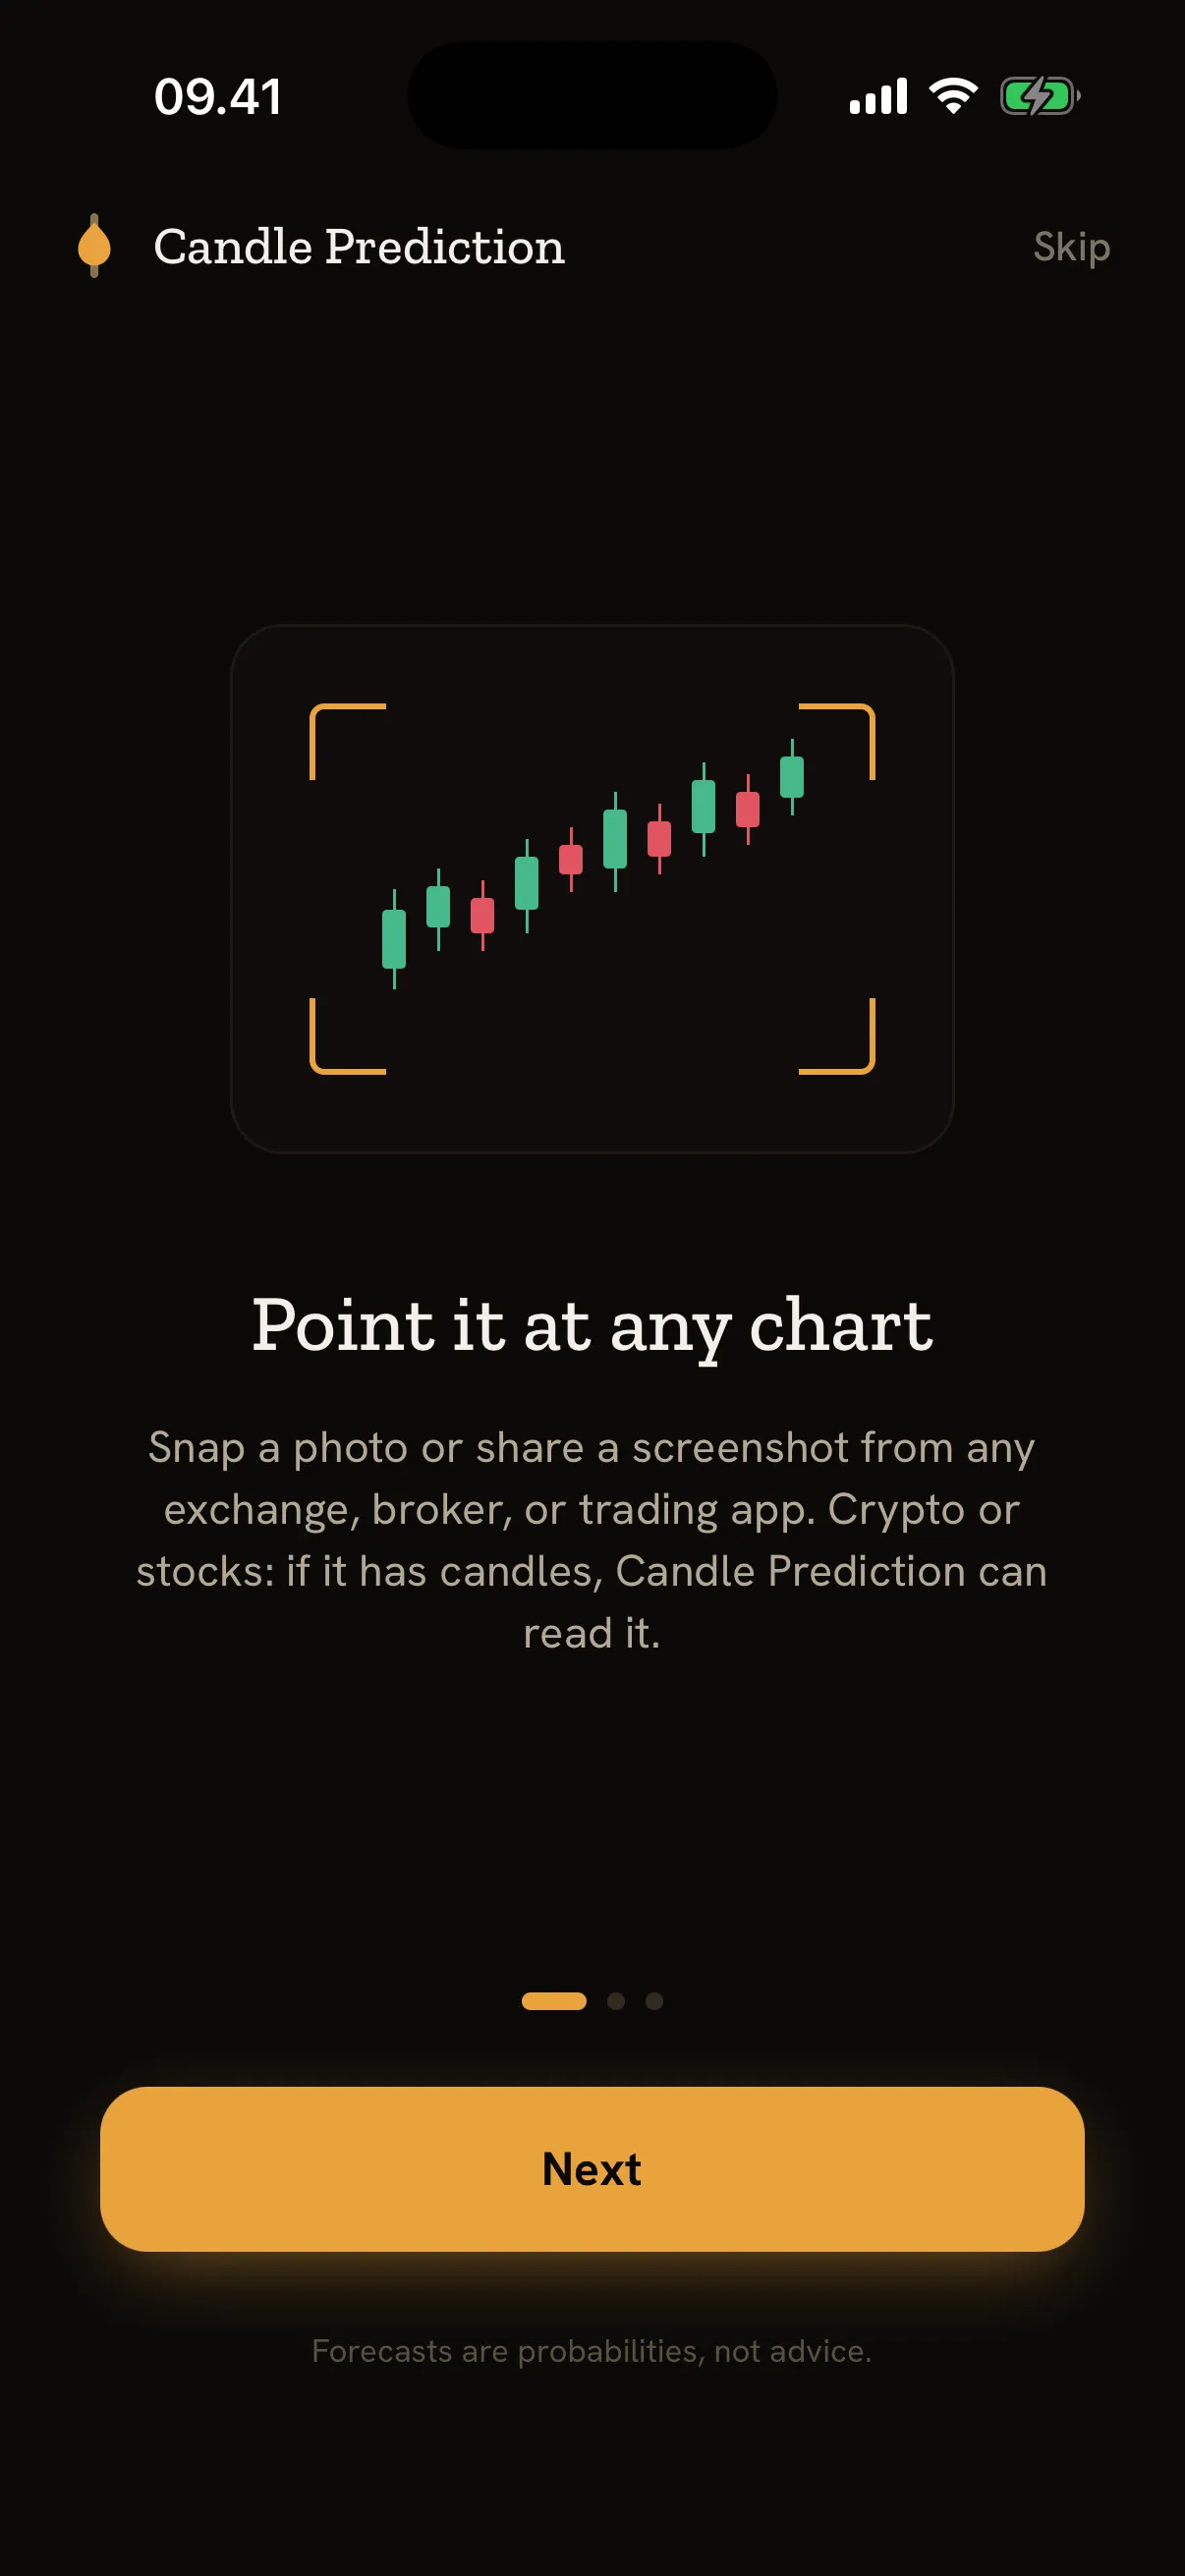
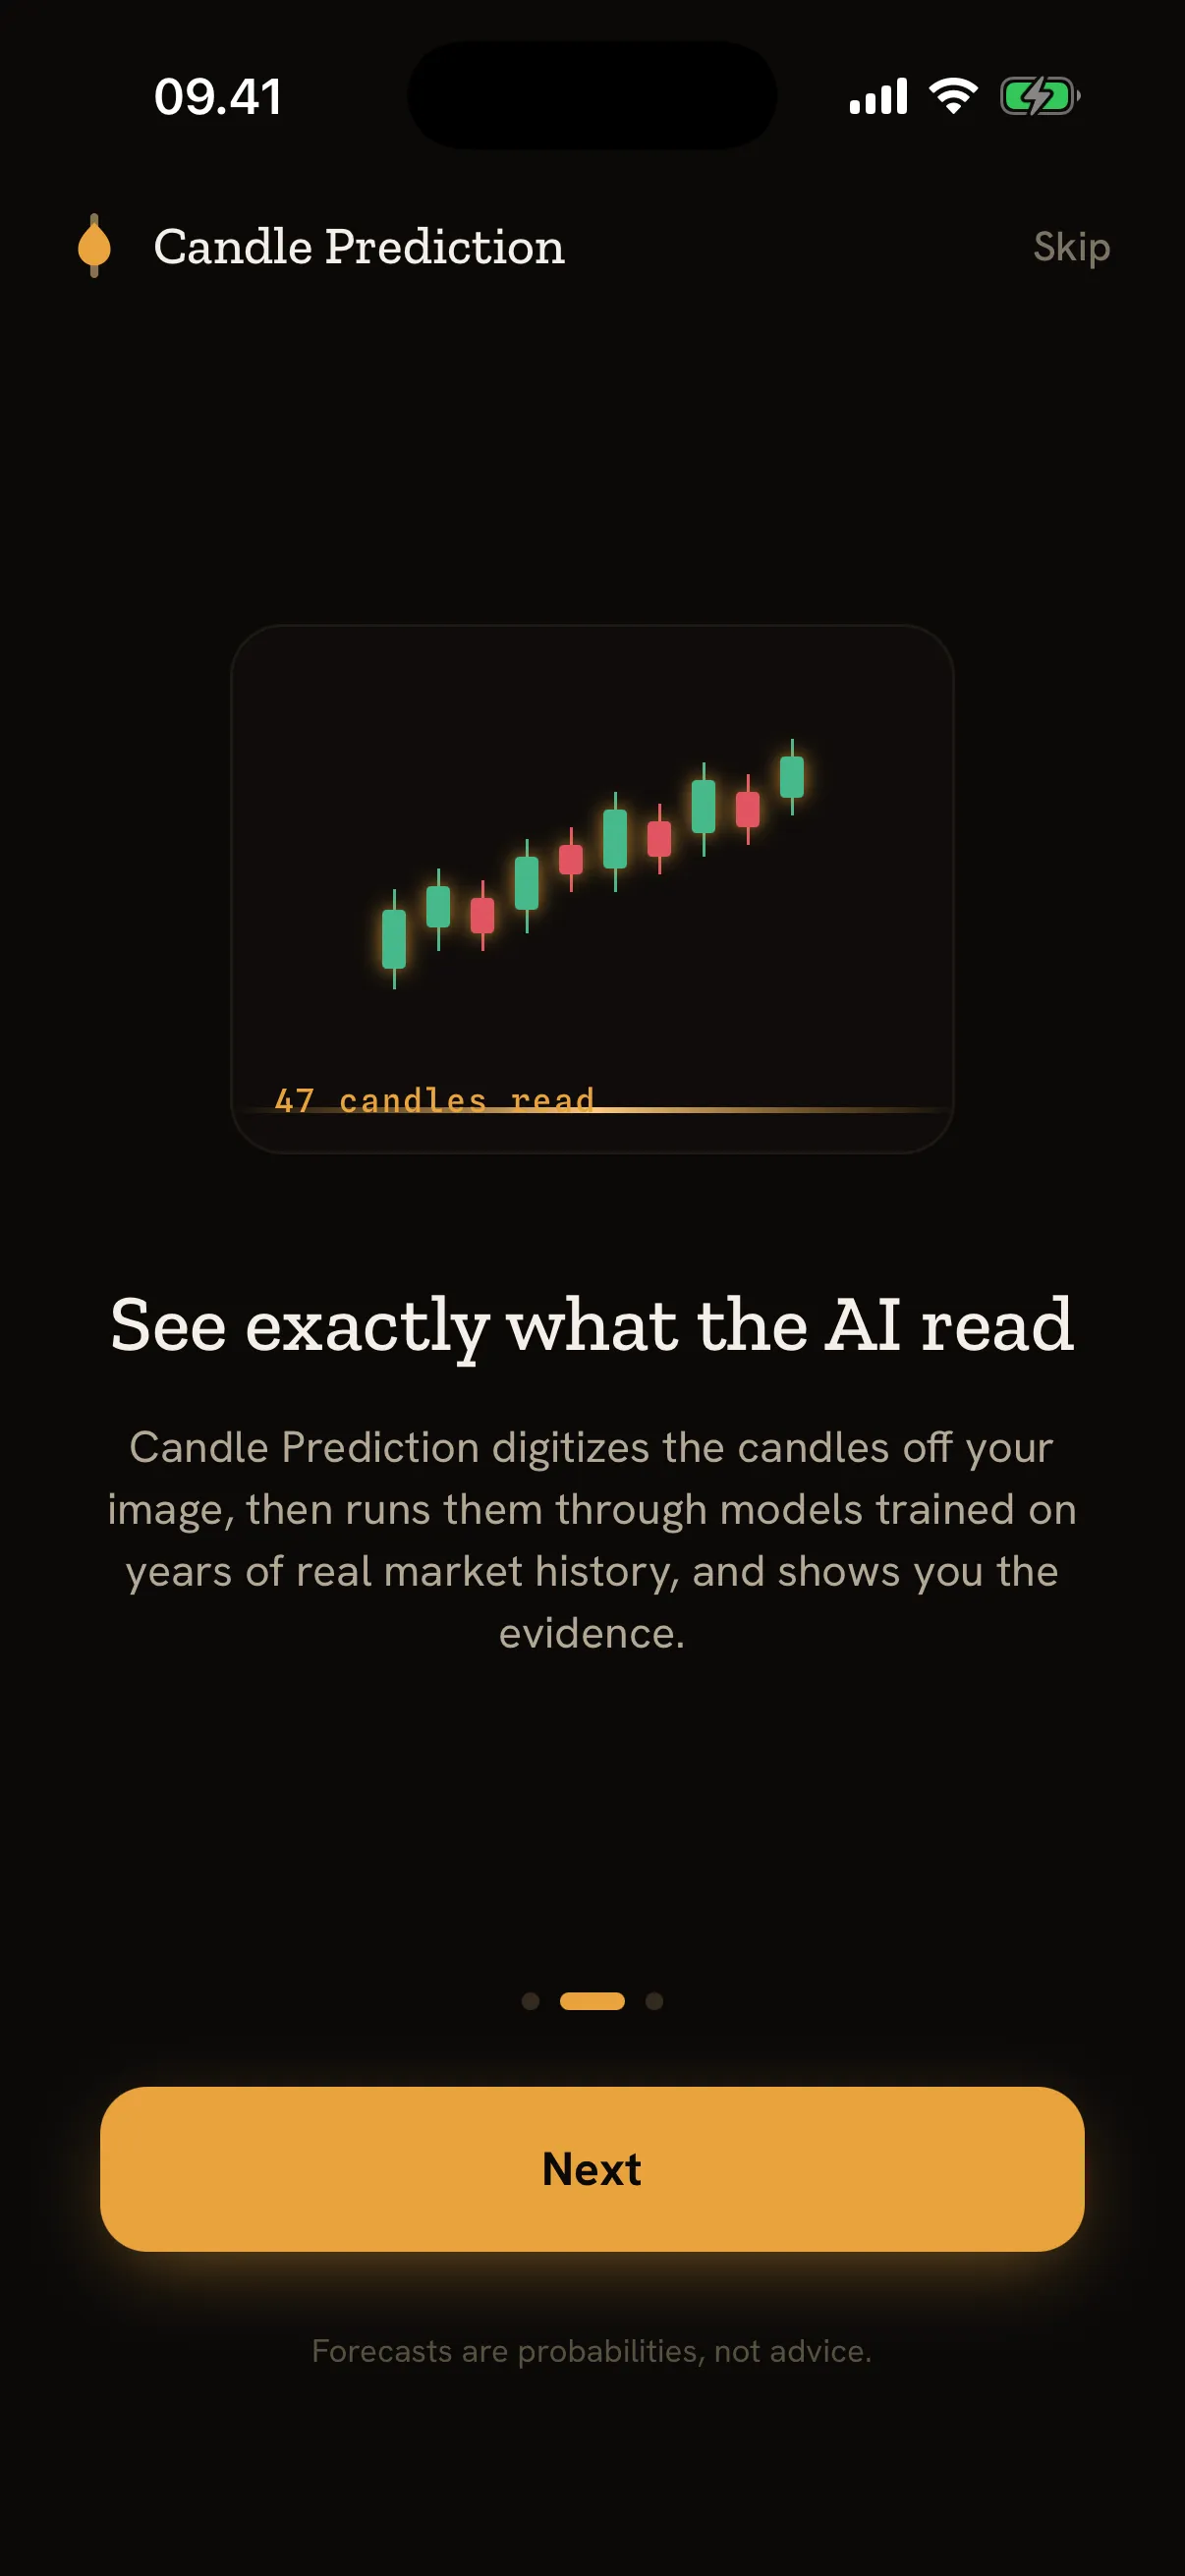
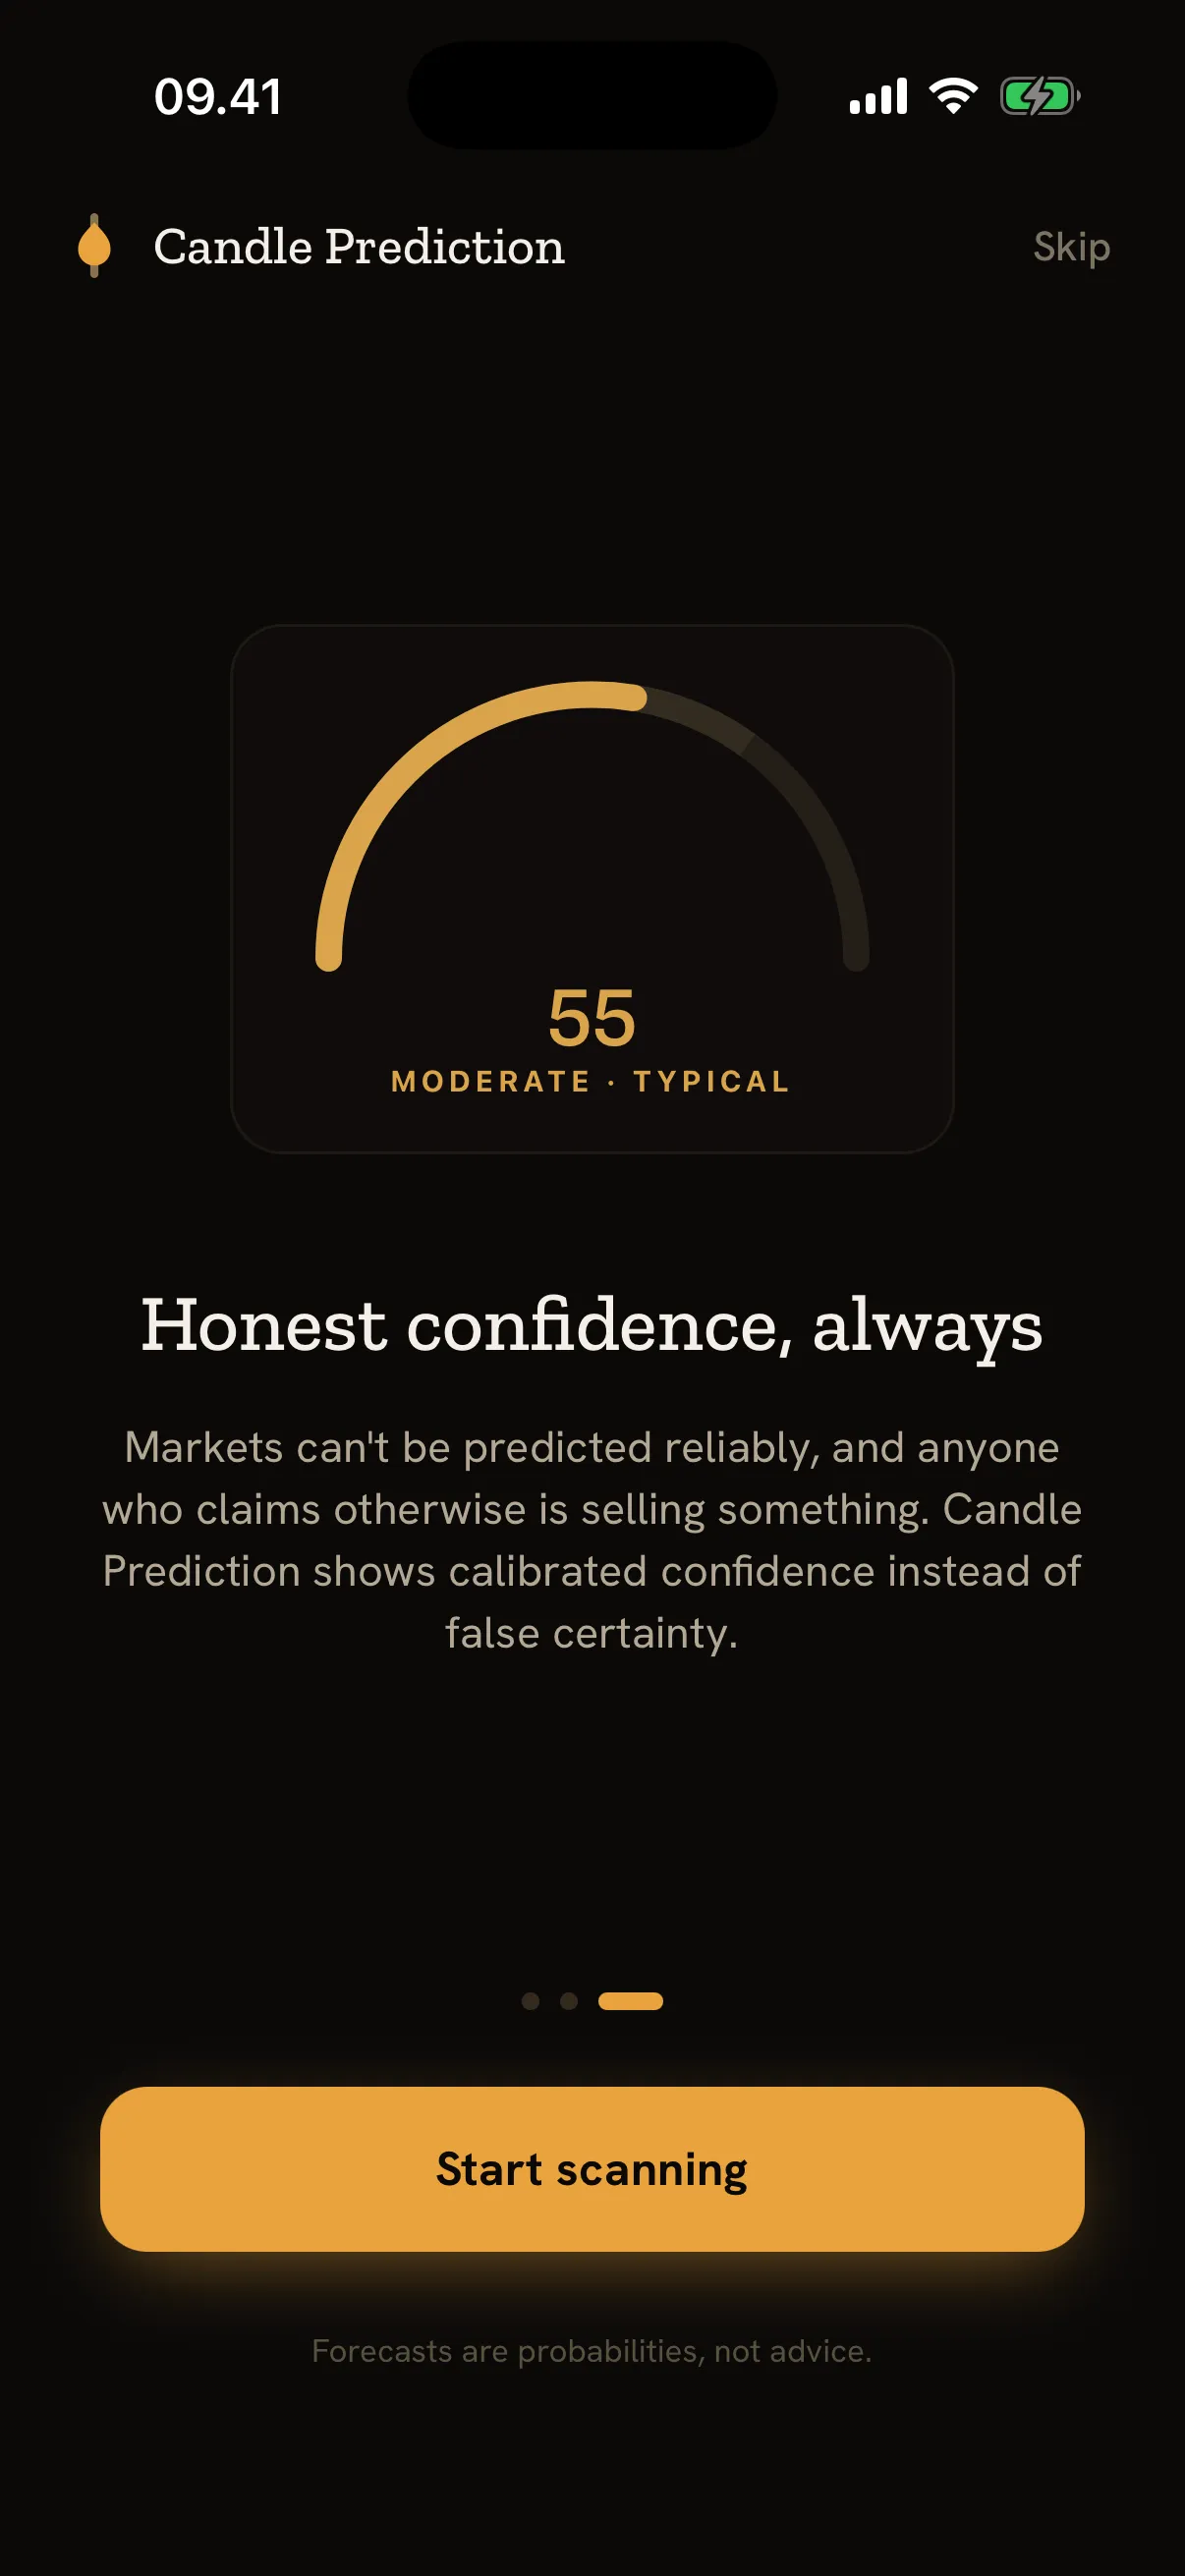
Fig. 01 — the claim we can actually defend
Four moves in five land inside the range.
Built to contain 80%. Measured at 81–85% on a split nothing was tuned on.
So we sell the other number instead: when it says 70%, that happens about 70% of the time — and that one we can show you.
Fig. 02 — how far it reaches
One real scan, dragged through the three horizons it forecast. The next candle is the easy one. Ten candles out, the probability has slid 4.5 pointstoward the floor and the range is 3.1× wider. Nothing here is smoothed to make that look better.
Drag, or use the arrow keys
BTC/USDT · 1h · 61 candles read
42.2% within 1 candle. With three outcomes the floor is 33.3%, so this call sits 8.9 points above guessing.
Top 10% of what this engine produces, about one forecast in ten. These landed right 40.2% against a 34.2% base. A real edge, and still nowhere near a certainty.
One archived scan · BTC/USDT 1h · 2026-07-22 · resolved against what the market did next. Not a simulation.
Fig. 03 — stated against observed
Each dot is a bucket of forecasts. Its position left to right is what the model claimed; up and down is what actually happened. A perfectly honest model sits on the diagonal.
Dots inside the corridor are sampling noise. Outside it is a miss, and two of these are.
| time | open | high | low | close |
|---|---|---|---|---|
| 07-21 22:00 | 66385.00 | 66388.35 | 66204.00 | 66304.02 |
| 07-21 23:00 | 66304.02 | 66576.00 | 66228.55 | 66556.16 |
| 07-22 00:00 | 66556.15 | 66739.89 | 66525.54 | 66620.97 |
| 07-22 01:00 | 66620.97 | 66661.79 | 66282.65 | 66433.30 |
| 07-22 02:00 | 66433.29 | 66532.26 | 66298.00 | 66314.12 |
| 07-22 03:00 | 66314.12 | 66371.27 | 66176.00 | 66210.00 |
Fig. 04 — the record, misses included
8 scans sampled at even intervals through the 728 others in the final-gate run, sorted by confidence. Not curated; misses included.
2 horizons called the wrong way.
2 horizons called the wrong way.
2 horizons called the wrong way.
2 horizons called the wrong way.
2 horizons called the wrong way.
Across these 8 scans: 10 of 20 directional calls were right, and 19 of 24 outcomes landed inside the 80% range. Both sit where the measured averages say they should — which is the only claim being made here.
Fig. 05 — the states it can return
Confidence is muted when it is low. The information never is. Hiding a weak read is the one thing that would make every strong read worthless.
Forecasts in this band landed right 40.2% of the time, against a 34.2% base rate.
Forecasts in this band landed right 34.5% of the time, against a 34.2% base rate.
Forecasts in this band landed right 30.9% of the time, against a 34.2% base rate.
Fig. 06 — the five inputs
One is a claim about how often the model is right overall. The other is a claim about whether its confidence means anything. A model can be barely better than chance and still tell you honestly which of its calls to trust — and that is exactly what the tiers do.
How far the models lean from a coin flip.
this scan: 0.164
Whether the model and the historical analogs point the same way.
this scan: 0.600
How closely past setups resemble this one.
this scan: 0.662
How cleanly the candles came off your image.
this scan: 1.000
How often the models have seen markets behaving like this.
this scan: 0.718
Fig. 07 — what it refuses to sell you
Direction measured 50–51% on the reserved split, against 47–51% for drift, with every interval containing a coin flip. We shipped that claim once. We measured it, it did not hold, and we took it down rather than round it up.
It describes what a chart looks like and what similar charts did next. That is the whole job.
A designed refusal, not a blank field. You get the shape of the forecast and an explicit note that the numbers are missing.
Refunded on any non-200. Retry as many times as you need.
The price is the price. There is no urgency to manufacture, so none is manufactured.
Stocks and ETFs
Three attempts at stock direction, none beating a coin flip, so we show none. How far it might move we can answer: the 80% range on daily equities held the outcome 80.7% of the time at ten days, with a mean width of 13.36%.
42 equities · daily · range only · ATR-scaled interval (the arm that shipped)
The largest of those refusals has its own write-up: eleven pattern detectors over 1.7 million bars, and every apparent edge dissolving once the control went deep enough. Candlestick patterns: a measured null
Calibration is the product. Direction is the coin flip we measure.
Price
Every camera scan runs AI vision over your image, then a quant engine over 230,000 historical windows. That is real compute each time, and this is what pays for it. Forecasts from the built-in market list don't use the camera, so you get 7 of those free every day.
$9.99/mo
15 scans a month
$24.99/3mo
15 scans a month · $8.33/mo
$49.99/yr
14 scans a month · $4.17/mo
One-time · never expires
$7.99
One-time · never expires
$17.99
Packs cost more per scan than every subscription, and always will — a test fails the build if that inverts. No countdown timers, no vanishing discount. A failed or unreadable scan never uses a credit.
Not submitted yet. The form below is the only way to hear about it, and it sends one message.
Forecasts are probabilities, not advice.